Editor’s Note: Omar Ayales is the chief strategist and editor of Gold Charts R Us, a weekly trading service going in its 20th year providing market insight to traders and investors that are looking to profit from price movement in commodities, stocks, and bonds. Mr. Ayales is an active student of the market and uses correlated technical analysis to guide him thru his winning trades. Gold Charts R Us is widely utilized by private and institutional investors around the world for its analysis of price movement
 Hard Stuff
It’s not just the Federal Reserve, it’s the Bank of England, the ECB, and most major central bankers around the world aching to normalize monetary policy. Whether its tapering of asset purchases or raising interest rates, the message seems clear: we’re past peak liquidity.
The continued rise in asset prices are making global monetary authorities nervous that inflation may get out of hand. Particularly because inflation spurred in the aftermath of the Covid led lockdowns in 2020 hasn’t been seen in decades. However, the reality remains that bottlenecks in supply chains persist and new factors are keeping supply chains strained.
Restricted supply will continue to put upward pressure on asset prices, especially resources due to speculation. Inflation has more to do with growing demand rather than ongoing supply bottlenecks. However, the data is not yet supporting this issue consistently, starting with global unemployment data that remains higher than where it was pre-Covid-19.
The rebound in interest rates is gaining steam. The U.S. 10-year yield is rising above resistance at 1.50%. This is putting downward pressure on Treasuries, particularly at the long end of the yield curve.
Time will tell if inflation will persist longer term or if it ends up being transitory. The tightening of monetary policy will be a reality check either way. However, any tightening of policy could be short lived if inflation fails to remain above the 2% threshold. ECB’s Laggard is already echoing Fed’s Powell in regards to the transitory nature of inflationary spikes.
It seems unlikely inflation will persist above the Fed’s 2% target without asset purchases and easy monetary policies until unemployment levels in the U.S. (and elsewhere) go back to pre-pandemic levels. Consider out of the U.S. alone, unemployment is nearly double where it was pre Covid 19. Without significantly lower unemployment, it’s unlikely to see output increased on a sustained basis.
Moreover, the resignations of the Boston and Dallas Fed chairmen (Rosengren and Kaplan), two of the most hawkish members of the Federal Open Market Committee (FOMC), it is to be seen how the committee could change its views. It’s very likely new appointees will be more dovish than their predecessors.
One of the biggest telltales for (dis)inflation is price action on the U.S. dollar index. The dollar price action is key since it is the reserve currency of the world, therefore, accounting for about 80%+ of global transactions. This means, when the dollar rises in value, most asset classes tend to fall in value; in other words, dollar strength tends to be deflationary. Likewise, when the dollar index falls in value, it tends to be supportive of higher asset values, broadly speaking.
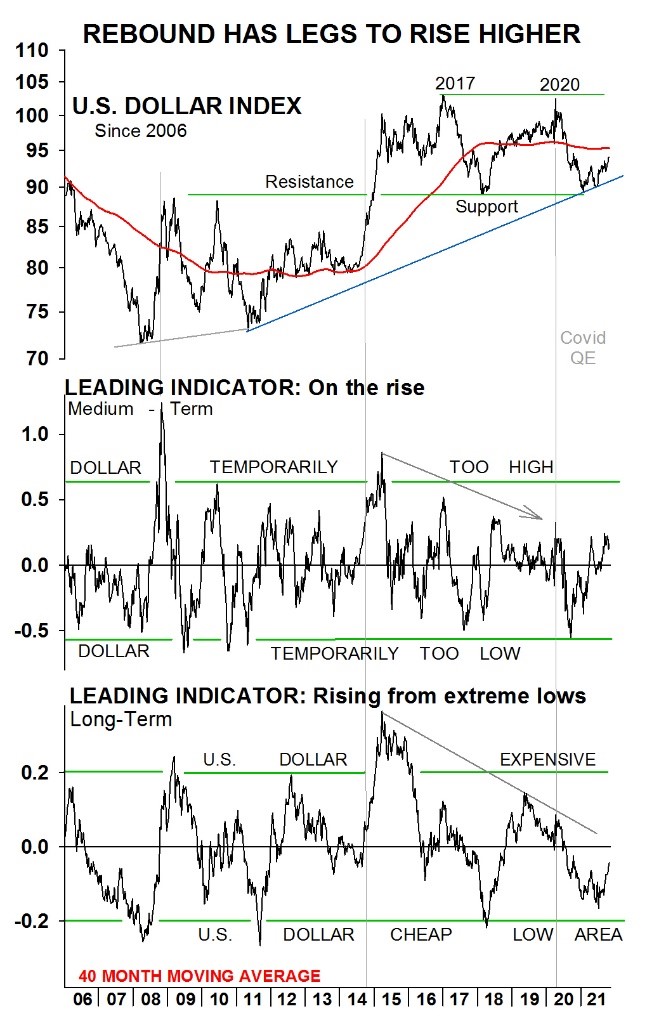 This first chart shows the U.S. dollar index with its MT and LT leading indicators since 2005. Notice the dollar has been in a bullish uptrend since the financial crisis broke out in 2008, gaining even more momentum at the end of 2014 when it broke above a key resistance (which today has turned into a key support level). Furthermore, a couple of years after the bullish breakout, the dollar peaked (2017) coinciding with a cyclical low in resources, energy and precious metals, broadly speaking.
Moreover, notice since 2017, the dollar has been moving sideways, with its previous resistance now turned support near 89, and the 2017/2020 highs becoming its new key resistance just above 100.
More recently, you’ll notice the dollar’s 2020 peak (March) coincided with a bottom in most asset classes. The following year saw energy, resources and precious metals once again rise to new highs. Not surprisingly, the dollar fell to the bottom side of this 5-6 year sideways band (89) and started floating upward. Currently, the dollar is just below a mega trend at 95. If broken, it could easily rise back to the high area in the lower 100s.
The leading indicators below the chart are bullish. The MT indicator is breaking out from a downtrend and high area; while the LT indicator is starting to rise from an extremely bombed out level. The LT indicator especially is suggesting the cyclical lows are near and a retest of the 2016/2020 highs is likely.
Strength in the U.S. dollar could be crippling for asset prices broadly.
The result ends up being a deflationary crunch of assets which could end up pushing U.S. Treasuries up. It could end up pushing gold up too, as gold has been moving together with Treasuries over the past 20+ years.
The spike in inflation this year due to supply bottlenecks is clouding the view of the stronger dollar and the dis-inflationary, or right-out deflationary, implications.
It is no coincidence global currencies remain under pressure relative to the U.S. dollar and that U.S. and global stocks are looking frothy, ready for a correction within the bull market.
The recent decline given the Fed’s policy stance is very telling. It also signals bells of caution. Taper Tantrum?
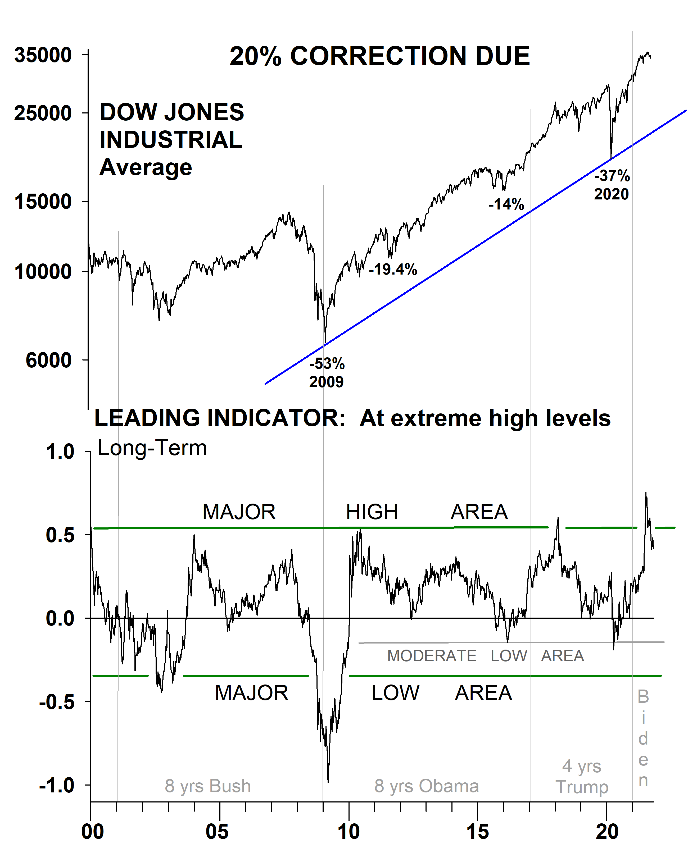 Notice this next chart shows the corrections or pull backs in the Dow Jones Industrials over the past decade. You’ll notice the current rise has not been as long as others compared in the past, but the rise itself has been and valuations seem stretched. A correction or pull back in U.S. Equities seems inevitable, but is it imminent?
Could we be at the onset of the shift from risk to safety? Will bonds rise in an inflationary environment like the U.S. dollar is signaling? Will gold continue on its 20+ year relationship with bonds?
Time will tell, the bells of caution are ringing.